
Thank you for visiting. This is Masafukuro.
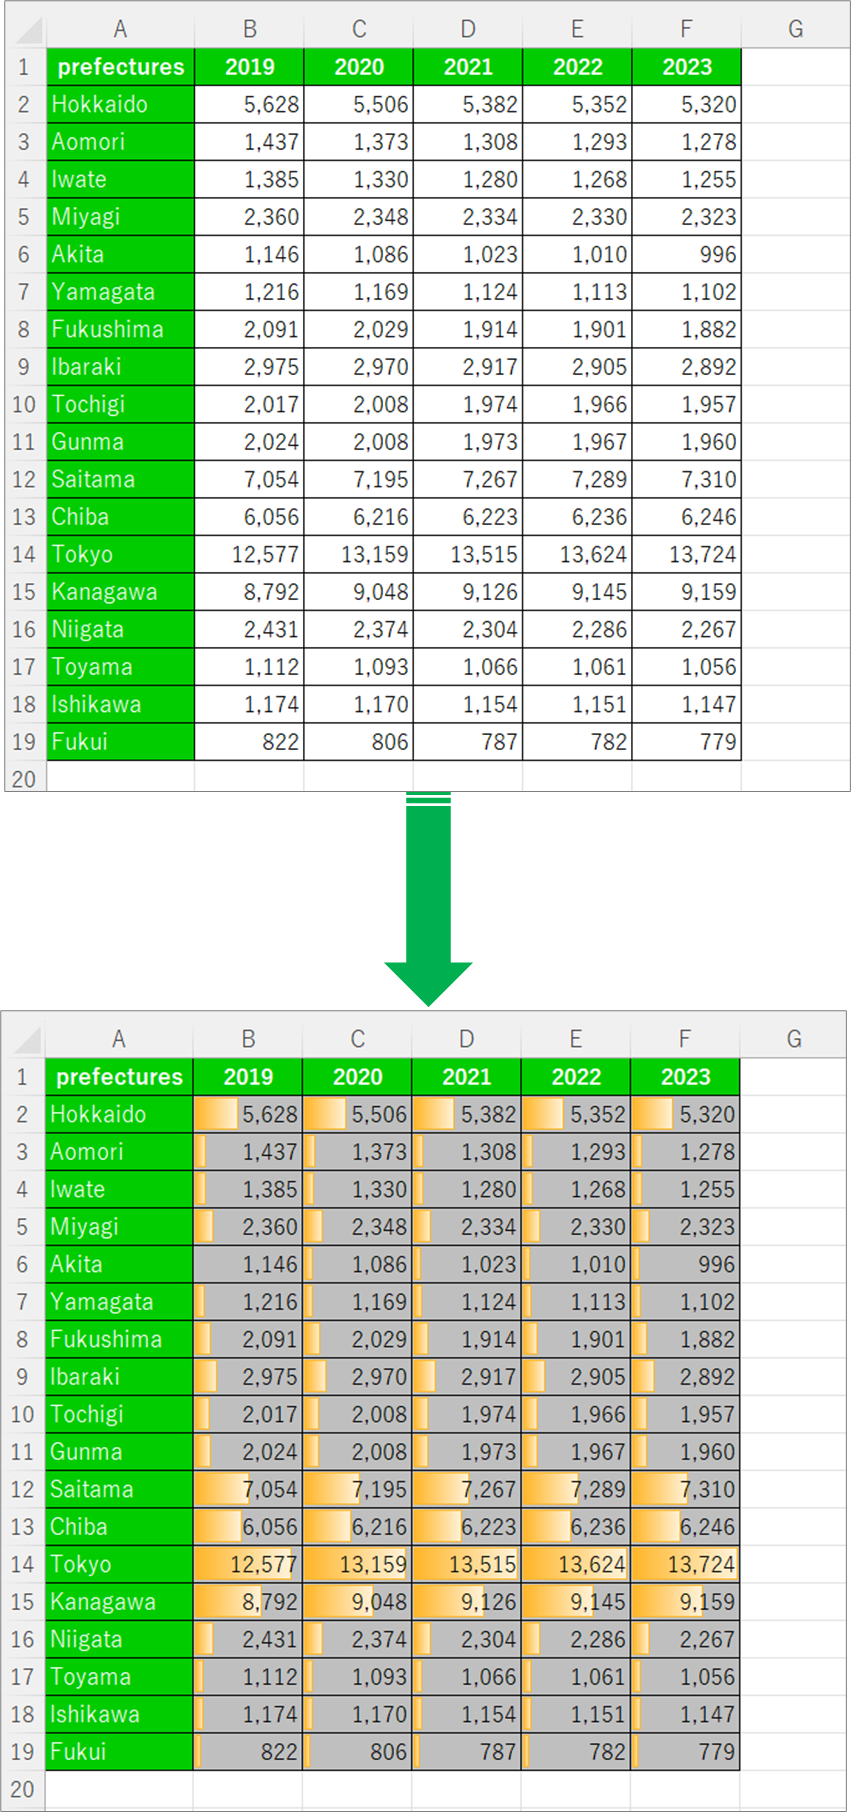
In this article, we will introduce an easy way to clearly show the differences in numerical values in statistical tables.
目次
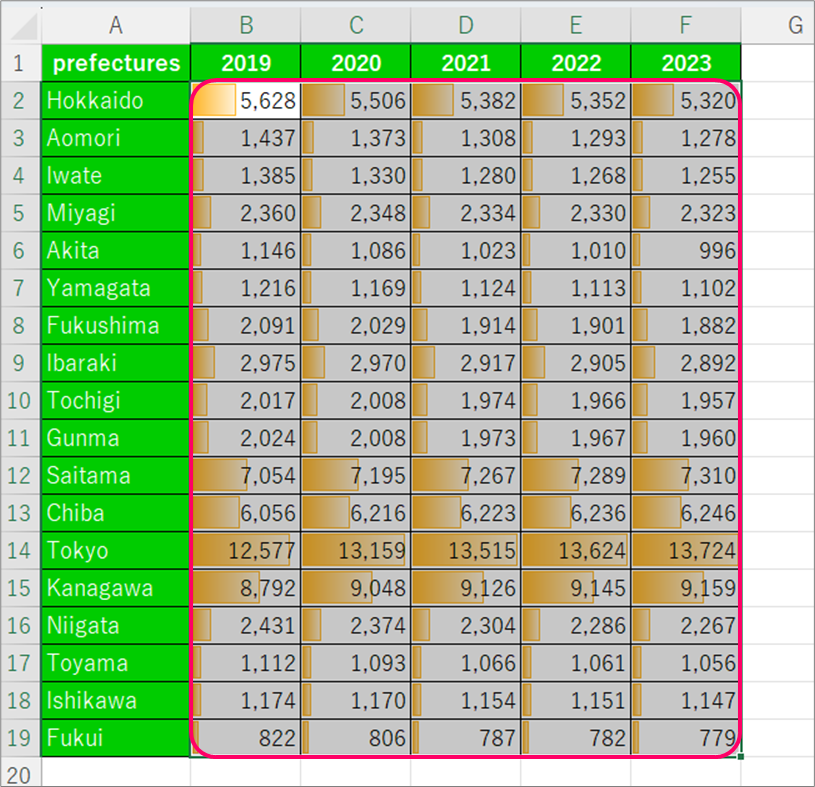
Easily show differences in numerical values in statistical tables in an easy-to-understand manner
Steps
General Process
Details
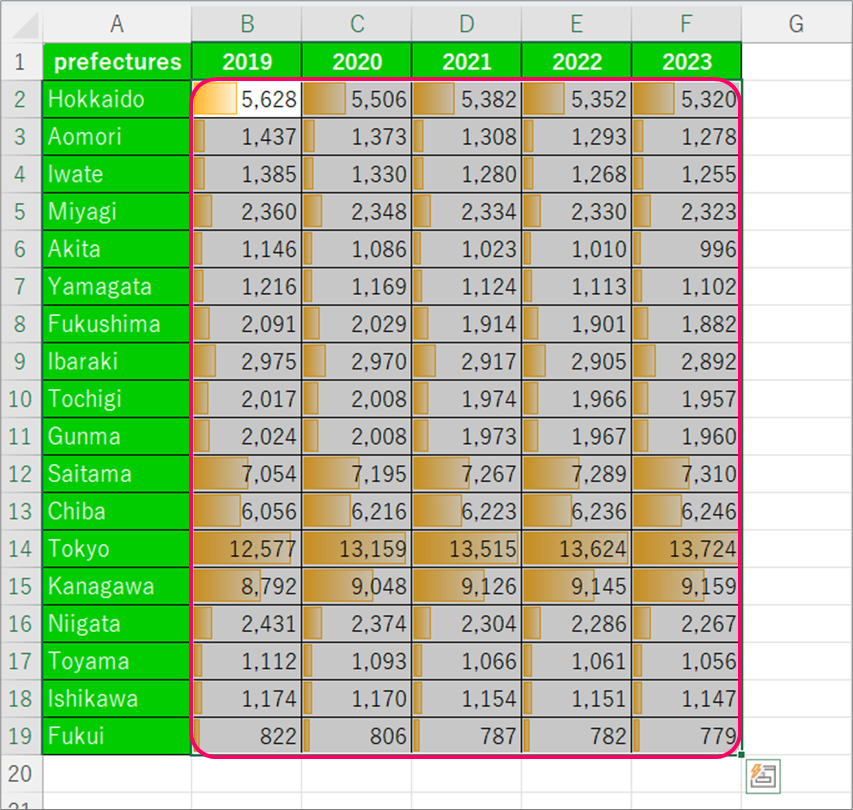
Step.1 Insert Data Bar
Select the target range.

①Click on the "Home" tab.⇒②Click on "Conditional Formatting" from the Styles menu
①Click on the "Home" tab.⇒②Click on "Conditional Formatting" from the Styles menu
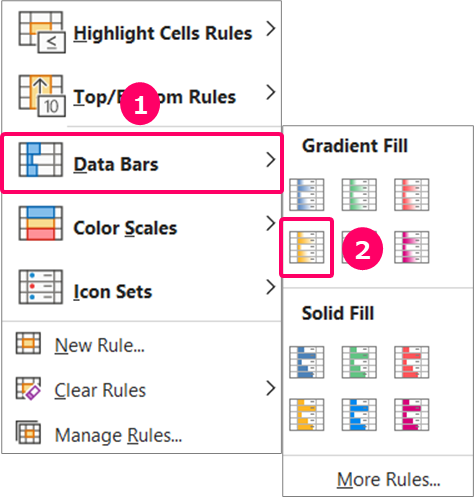
①Select "Data Bars"⇒②Select Orange Data Bar.
Step.2 color the cells
Select the target range.
①Click on the "Home" tab.⇒②Select "Fill Color" in the "Font" group.
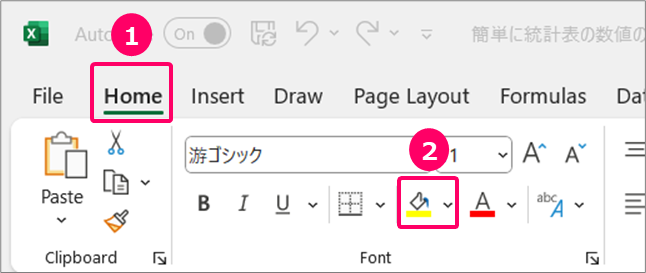
Choose a color.

Remove Data Bar
Select the target range.
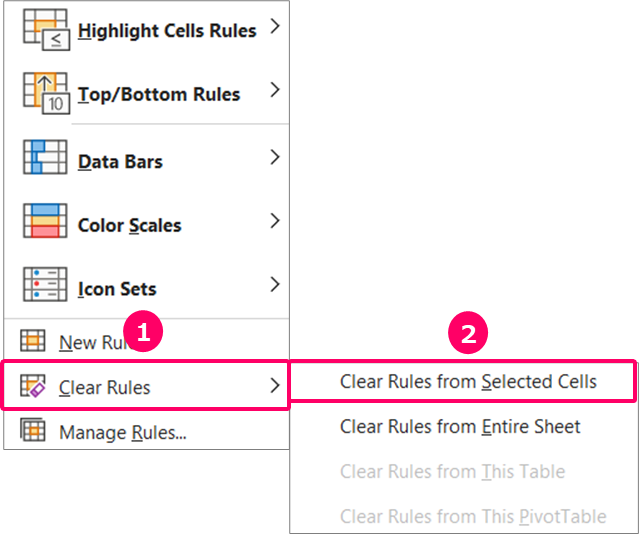
①Click on the "Home" tab.⇒②Click on "Conditional Formatting" from the Styles menu
①Select "Clear Rules"⇒②Select "Clear Rules from Selected Cells".
Related Articles
Thank you for reading until the end!