Thank you for visiting. This is Masafukuro.
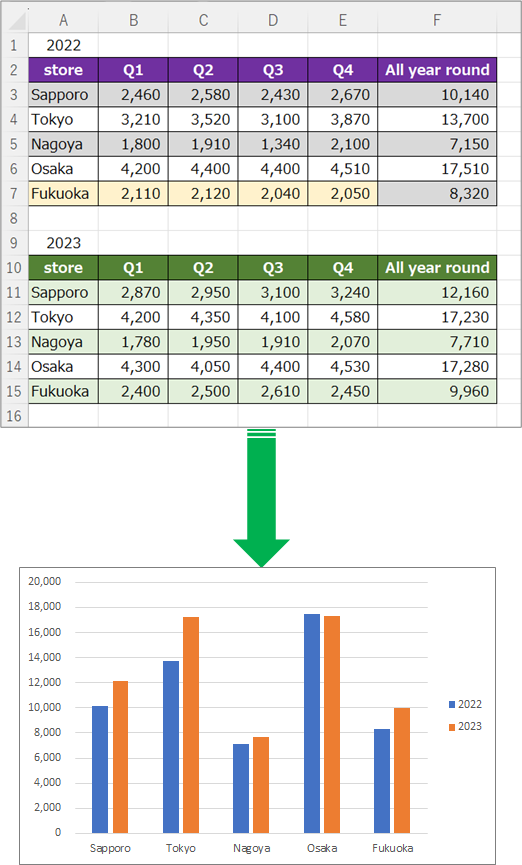
This article will show you how to combine multiple tables into one graph.
目次
Combine multiple tables into one graph
Steps
General Process
Details
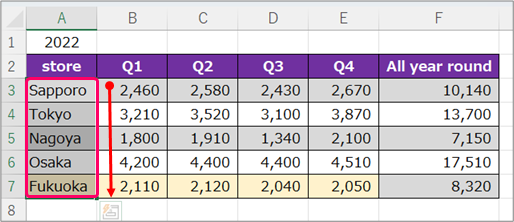
Step.1 Create a graph for 2022
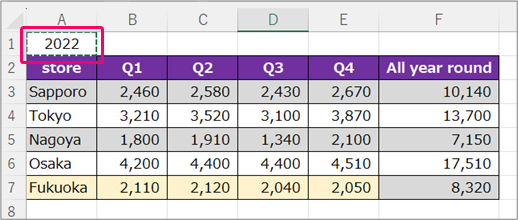
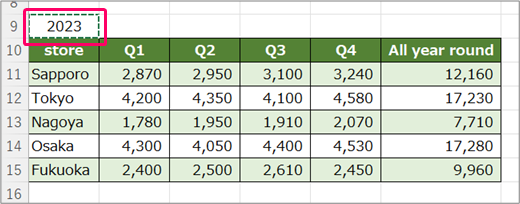
Select the "store" data part.
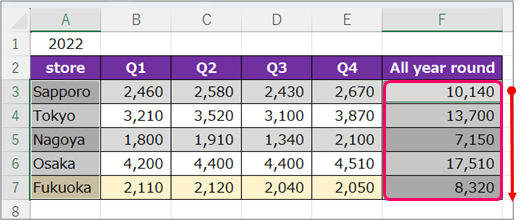
Next, hold down the "Ctrl" key and drag the "All year round" data part to select it.
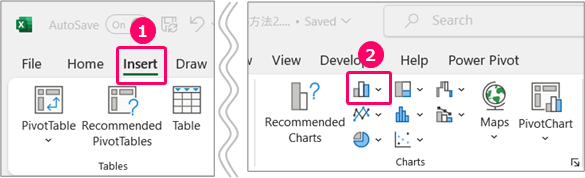
①Click on the “Insert” tab⇒②Click "Insert Column or Bar Chart" in the "Charts" group.
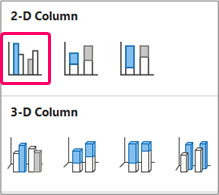
Select Clustered Column.
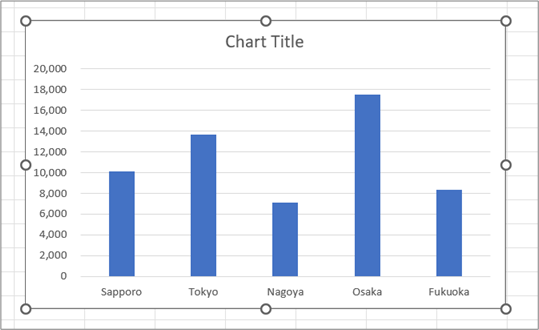
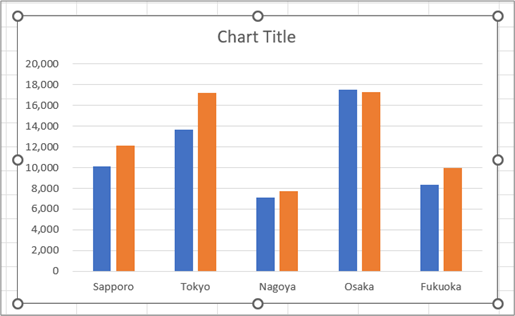
A bar graph will then be inserted.
Step.2 Added 2023 graph
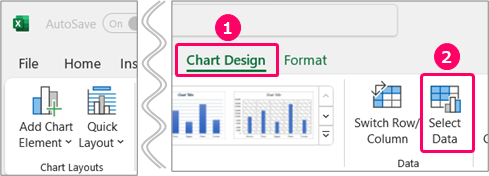
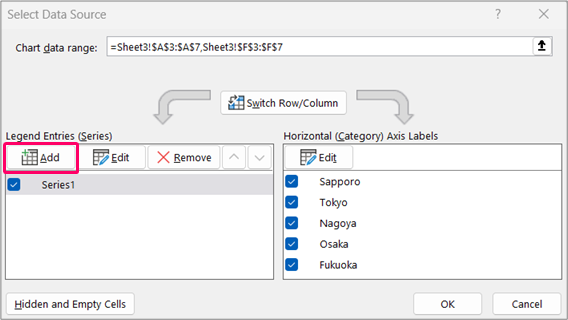
①Click on the “Chart Design” tab⇒②Click Select Data.
Click Add.
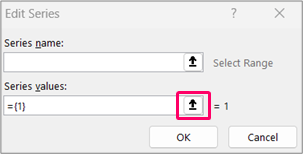
「![]() 」Click the icon.
」Click the icon.
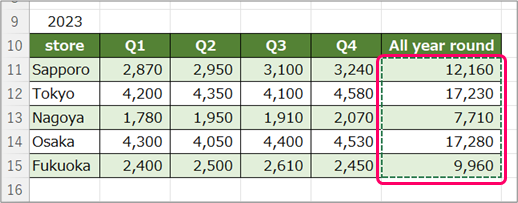
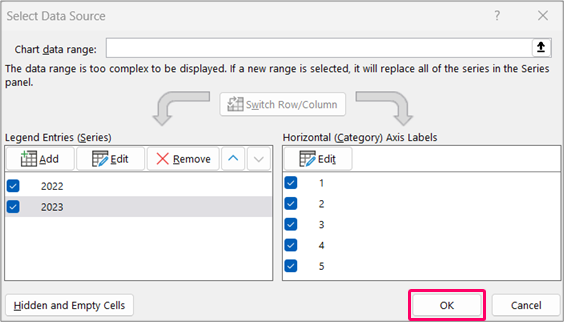
Select the "All year round" part of "2023".
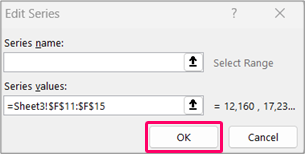
Click the OK button.
Then, the "2023" graph will be added.
Step.3 Edit Series name
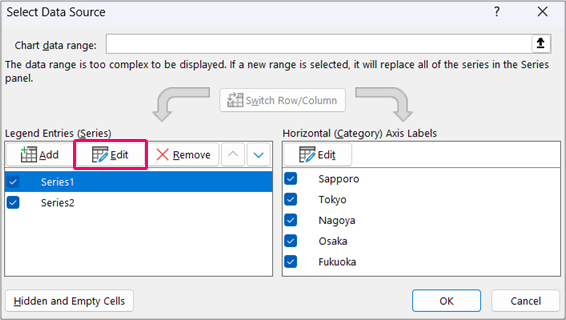
①Click on the “Chart Design” tab⇒②Click Select Data.
After selecting "Series1", click the "Edit" button.
Click on the "2022" part.
Next, select "Series1" and click the "Edit" button.
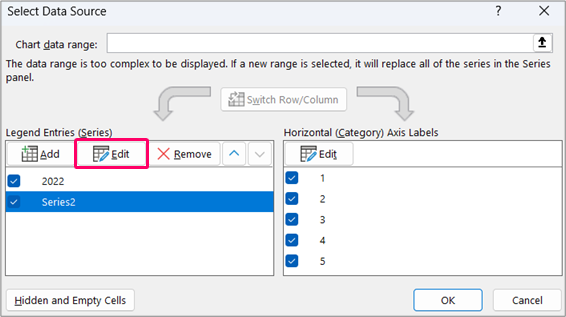
Click on the "2023" part.
Click the OK button.
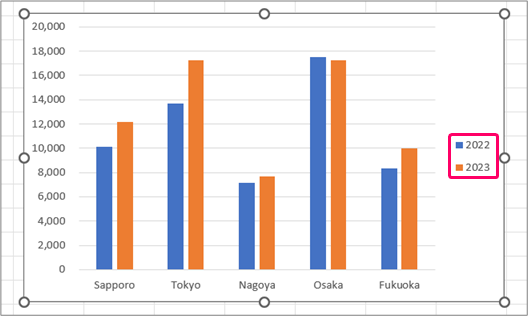
Step.4 Add Legend
Select the graph and click the "+" part.
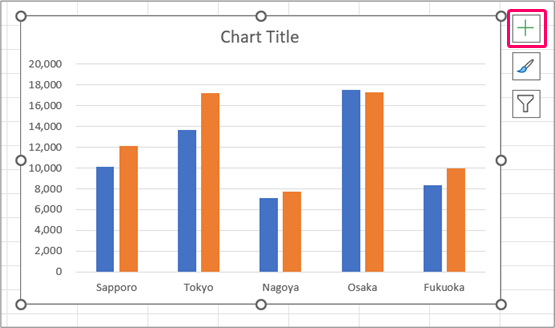
Check "Legend".
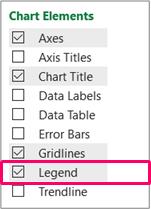
Then, "Legend" will be added.
Related Articles
Thank you for reading until the end!