
Thank you for visiting. This is Masafukuro.
In this article, we will introduce how to combine a line graph and a bar graph (combined graph).
目次
Combine bar and line graphs
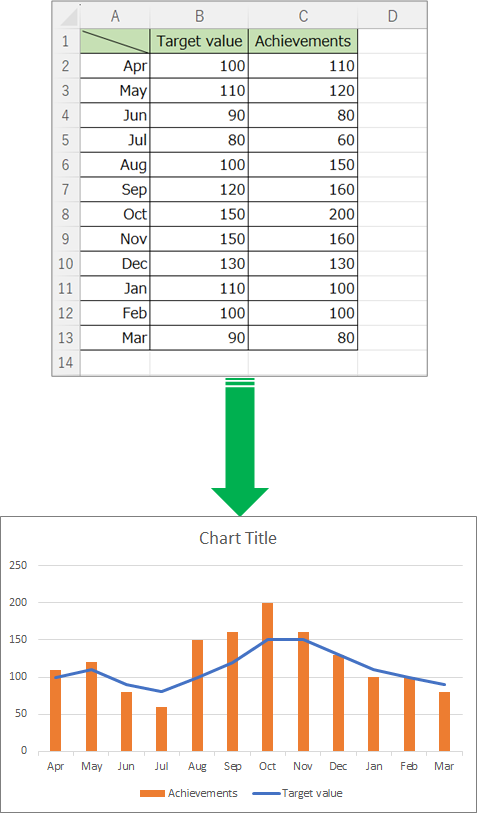
Sample Data
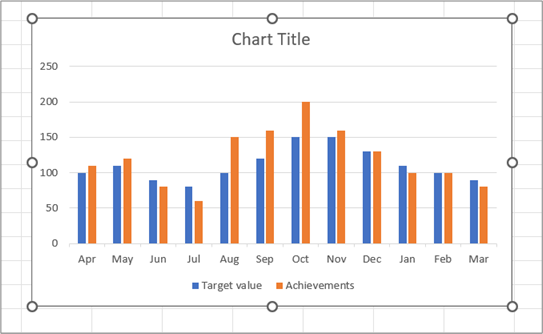
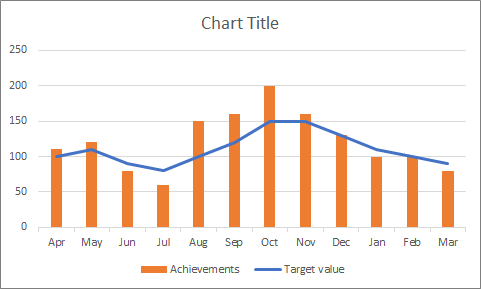
| Target value | Achievements | |
| Apr | 100 | 110 |
| May | 110 | 120 |
| Jun | 90 | 80 |
| Jul | 80 | 60 |
| Aug | 100 | 150 |
| Sep | 120 | 160 |
| Oct | 150 | 200 |
| Nov | 150 | 160 |
| Dec | 130 | 130 |
| Jan | 110 | 100 |
| Feb | 100 | 100 |
| Mar | 90 | 80 |
Steps
General Process
Step.1insert bar graphStep.2Change from bar graph to line graph
Details
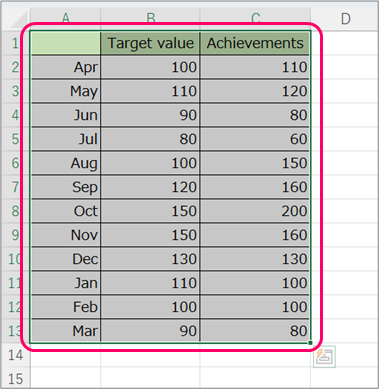
Step.1 insert bar graph
Select the table.
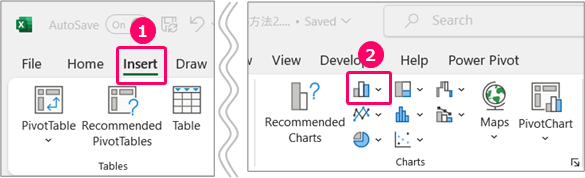
①Click on the “Insert” tab⇒②Click "Insert Column or Bar Chart" in the "Charts" group.
Select Clustered Column.
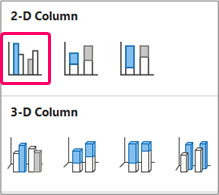
A bar graph will then be inserted.
Step.2 Change from bar graph to line graph
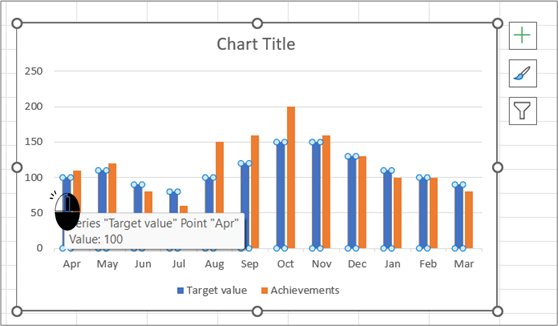
Click on the bar graph to select it.
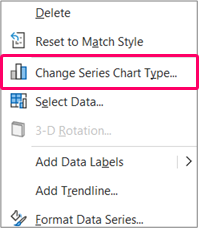
right click⇒Select Change Series Chart Type from the shortcut menu.
①Select "Combo"⇒②Change "Chart Type" of "Target value" to "Line".⇒③Click OK.
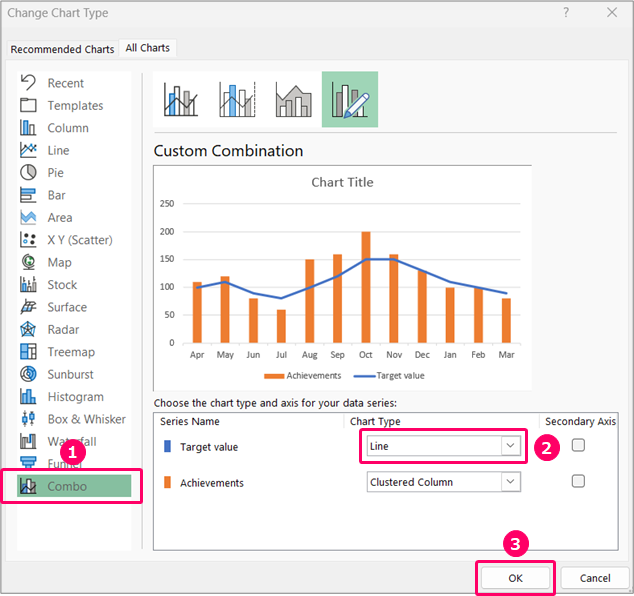
Then you can combine bar graphs and line graphs.
Related Articles
Thank you for reading until the end!